The introduction of 9th edition has generated a lot of excitement and intrigue, much of which is represented in our Faction Focus article series. Additionally, we’ve discussed what we believe to be the competitive implications for both the new rules and the new mission structures for competitive play as outlined in the Core Rules and the GT Mission Pack. Changes to the rules for terrain, mission mechanics, and objective scoring have seismic implications for how 9th is played compared to 8th.
In our reviews we have theorized that 9th edition’s Matched Play and GT missions confer an outsized advantage to the player who goes first. There are a few reasons to believe this:
- The player going first will have two full turns of shooting and assaults prior to the second player’s first opportunity to score any primary objective points and many secondary points
- The player going first has full information on primary scoring in round 5
- The player going second cannot impact scoring for the first player any further in round 5 outside of a few select secondary objectives that rely on keeping units alive
On the flip side, it could be argued that the player going second has the opportunity to react and that proper terrain means that the player going first must expose themselves to action from the player going second. Additionally, players do not know whether they will be going first or second when they deploy their armies.
But are these advantages real, and do they translate to an unfair advantage for the player going first? It’s easy to say all of this and argue about it online but the reality may be far different. To better understand this reality and the impacts of going first we partnered with tournament organizers globally to collect and aggregate results from responsibly run events. In this report we will attempt to identify what, if any, the impact of having first-turn has on a player’s chances of winning and attempt to characterize that impact. Further, we will look at other factors that may be associated with our results.
Note that these results are preliminary – we’ve done our best to collect a robust data set and done appropriate significance testing where possible, but many of these results should be considered provisional until we have a larger data set to work from.
Methodology
The data for this article was collected from 9th edition events run between July 25 and August 16, 2020 from volunteer tournament organizers across the globe. For each event the organizers were asked to record and report which player went first at each table. This was then compared to the reported game results in Best Coast Pairings and used to categorize wins into two groups: Go-First Wins and Go-Second Wins.
Our sample included the following events:
- The Wizard Asylum (5-round, GT) – July 25-26th
- Vanguard Tactics (6-round, GT) – August 1st-2nd
- Flying Monkey Con (6-round, Major) – August 15-16th
- Battle for Survival (5-round, RTT) – August 15-16th
First turn results were tracked by round and by event. In addition to win percentages, we also tracked Victory Points (VP) scored, Opponent Victory Points (OVP) scored, and army factions. We excluded any results that led to a ‘draw’ or ‘bye’ and we excluded any events that were not a minimum of 5 or more rounds, with at least 24 players, in a Swiss-pairing system. There are a few reasons for this:
- Events with 5 or more rounds will see a larger variety of missions being played and reduce the impact of an individual mission skewing the results.
- In Events with 5+ rounds, pairing players based on record matching will help even out and reduce skill disparities in later rounds which gives us better data for analyzing the impact of first turn.
- 24 players is the minimum number of players required to prevent player skill mismatches in the later rounds of a 5-6 round event.
We do not believe that representative data on competitive 40k events can be obtained with a sampling of three-round RTTs due to their high variance in army mix, player skill disparity, terrain, and in the difficulty of sampling. Statistical analysis was conducted to identify descriptive statistics and test the significance of the data observed.
For one of the events – the August 1st Vanguard Tactics GT event, we were unable to attain full round and event data, and the data from the event was not all collected at the time of the active round during the event. Based on this we have excluded the event from our overall analysis. We will note the event’s limited results and potential implications within our discussion later, particularly as it relates to terrain and in mission-specific results.
The Burning Questions
Let’s start with the big questions we (and hopefully, you) have about the 9th edition meta, and try and answer them as best we can using the data at our fingertips. There’s a lot to cover here and while we’ve done a ton of statistical analysis on the back-end to validate some of the conclusions, we’ve moved most of that to the Appendix at the end of the article for readability’s sake.
Does Going First Give You an Unfair Advantage in 9th Edition?
Overall, in 197 of the 340 games in our sample, the player who went first won the game resulting in an overall win percentage of 57.9%. We’ll dive into some of the statistical work around this in the appendix, but this is just enough to put us 3 standard deviations over the expected mean wins (170), and gives us a high confidence (99.7%) that players who have the first turn win a significantly higher proportion of their games than players who go second. Generally speaking, if we expected results to be roughly even, then we’d expect a max range within the sample of 46% to 54% go-first win rate given the sample size.
Case closed.
Wait, there’s more? Of course there’s more – this is Goonhammer. The events in our sample tended to use random pairings in round one, and then match players based on their records each round afterward, meaning that as tournaments progress, players are more likely to be matched against players of equal skill. This means that as events progress, the impact of going first should increase rather than decrease if it is providing an unfair advantage since the player going second will be less likely to overcome a structural disadvantage with their skill.
Let’s look at how these results changed by round. Note that our sample is smaller on a per-round basis, and the mission being played each round may also affect the go-first win rate.
| Round | Go First Wins | Total Games | Win Pct |
|---|---|---|---|
| 1 | 29 | 64 | 45.3% |
| 2 | 37 | 64 | 57.8% |
| 3 | 37 | 63 | 58.7% |
| 4 | 35 | 59 | 59.3% |
| 5 | 39 | 58 | 67.2% |
| 6 | 19 | 32 | 59.4% |
This trend seems to support our hypothesis – namely that in round 1 first turn is less likely to yield an advantage but as rounds progress the advantage of going first becomes larger as players on more even skill footing are given an advantage over their opponents. If we look at these results broken out by event (warning: small sample sizes incoming), we can see a similar trend, though Battle for Survival does seem to buck the trend a bit, with higher-than-expected round 1 go first win rates – we’ll get to this in a bit.
The Wizard Asylum GT – 32 Players, 73 Counted Games
- Round 1 – 7/15 Go-First Wins – 46.7%
- Round 2 – 6/15 Go-First Wins – 40.0%
- Round 3 – 9/15 Go-First Wins – 66.7%
- Round 4 – 11/14 Go-First Wins – 78.6%
- Round 5 – 11/14 Go-First Wins – 78.6%
Totals: 45/73 Go-First Wins – 61.6%
Battle for Survival – 24 Players, 55 Counted Games
- Round 1 – 8/12 Go-First Wins – 66.7%
- Round 2 – 7/12 Go-First Wins – 58.3%
- Round 3 – 7/12 Go-First Wins – 58.3%
- Round 4 – 5/10 Go-First Wins – 50.0%
- Round 5 – 5/9 Go-First Wins – 55.6%
Totals: 32/55 Go-First Wins – 58.2%
Flying Monkey – 74 Players, 212 Counted Games
- Round 1 – 14/37 Go-First Wins – 37.8%
- Round 2 – 24/37 Go-First Wins – 64.9%
- Round 3 – 21/36 Go-First Wins – 58.3%
- Round 4 – 19/35 Go-First Wins – 54.3%
- Round 5 – 23/35 Go-First Wins – 65.7%
- Round 6 – 19/32 Go-First Wins – 59.4%
Totals:120/212 Go-First Wins – 56.6%
Total Results:
- 197 of 340 Go-First Wins – 57.9%
So currently the answer to the question, “Does going first give you an unfair advantage in 9th edition?” appears to be: Yes.
However, we also want to understand a little more about why does going first confer an advantage. The answers to that are a little less clear and may be a combination of different explanations with different levels of impact.
How do Victory Points change in games with a go-first win?
Robert: Coming into this analysis, I had a theory that games in which the winner went first would be higher-scoring affairs, owing to the winner being more likely to score more points early on. By contrast, I expected go-second victories to be lower-scoring, dependent more on stopping player 1 from scoring and keeping things manageable. On the whole, that doesn’t appear to be the case: the average total score for games with a go-first win was 132.5, compared to 137.2 for go-second wins. If anything that’s the opposite result, but given that the sample standard deviation for total game score is 21, that’s hardly significant. I’m surprised to see this result, but things don’t always have to confirm my priors.
Boon: Overall scoring might not be in favor of higher-scoring games when the winner goes first but there are other factors to consider, such as whether an opponent going first has a points advantage overall. In our sample of 197 go-first wins, the winning player scored an average of 85.1 VP compared to only 47.2 for the opponent, while in our sample of 143 go-second wins, the average winner score was 85 points to an average of 52.7 VP for the opponent. That is statistically significant with a high confidence (99.6%), suggesting that players who have the first turn reliably prevent their opponents from scoring more points than players who go second, to the tune of about 5 points per game.
Is there a difference between early vs. late rounds?
Because we believe that the Swiss pairing system will eventually match players of like skill, decreasing the skill discrepancy in games as the event progresses, we wanted to look into Day 1 versus Day 2 results. In all cases, Day 1 results comprised three games and Day 2 results at least had two games, with the one 6-game event in the sample featuring three Day 2 games. If our theory is correct, then a 6-game event should result in higher win percentages for the player going first than a 5-game event, since each subsequent match provides an even larger opportunity for players to be evenly matched on skill set and army quality. Unfortunately, we don’t yet have enough data to conclude this one way or another on round 6 vs. round 5, but we do have ample results to support a Day 1 vs. Day 2 analysis.
Our sample included 191 games on Day 1, of which 104 saw the player who took the first turn winning the game (and 87 in which the player going second won), giving us a 54.5% go-first win percentage. Overall, this isn’t what we’d consider a statistically significant advantage to the player going first, and as we saw earlier that’s driven by Round 1 having the highest go-second win percentages in our sample. Similarly, we had 149 games played on Day 2, of which the player going first won in 93, good for a 62.4% go-first win percentage. That is a statistically significant result and suggests that on Day 2 the player going first has a significant advantage.
Overall this supports our hypothesis that in Day 1 highly skilled players are more able to overcome going second by outplaying their opponent and taking advantage of gaps in skill. Additionally, a higher-skilled player is more likely to leverage the intrinsic benefits of going first much more effectively and consistently than the lower skilled player.
Does the mission being played affect this?
We also wanted to take a look at how the mission being played may affect the go-first win rates. Functionally, there are two different ways we can look at this data. The first is to examine the differences in the type of primary objective used, i.e. Take & Hold vs. Domination, and the second is to look at the mission itself.
Take and Hold vs. Domination
Let’s start with the broadest category and the most robust data set. Among the 9 Strike Force GT Missions, 6 have Take & Hold Primary Objective Scoring and 3 have Domination Primary Objective Scoring.
- In Take & Hold, players score 5 VP each for holding one, two, and more objectives than their opponent.
- In Domination, players score 5 VP each for holding two, three, and more objectives than their opponent.
Additionally, two of the three Domination missions have 6 objectives, compared to only two of the six Take & Hold Missions (and two of the Take & Hold missions feature only 4 objectives).
Let’s start by looking at win rates:
| Primary Scoring Type | Total Games | Go First Wins | Go First Win % |
|---|---|---|---|
| Domination | 139 | 79 | 57% |
| Take & Hold | 201 | 118 | 59% |
| Total | 340 | 197 | 58% |
There’s still a significant advantage to the player going first in these missions, but it’s worth noting that it seems to be even more pronounced for Take & Hold missions, though the difference between these two proportions is not itself statistically significant. Note that this holds (and becomes more pronounced) if we factor in the incomplete Vanguard Tactics event data as well. Finally, it’s worth noting that this should be considered directional: we’ve already seen that later rounds have higher win-first rates, and so in future analyses we’ll look to control for round number to extricate the effects of record matching and mission from each other.
Boon: We also wanted to look at the VP differences with these missions. Overall, players going first in Take & Hold missions scored 85.5 VP and allowed 49.8 VP on average, while players going second scored 86.8 and allowed 53.6 on average – no significant difference there for either points scored or points allowed, though points allowed was close and more data could affect this.
On the other hand, in Domination we found that players who went first scored an average of 84.1 VP and allowed 40.8 while players who went second scored 81.5 VP and allowed 50.7. That nearly 10-point jump in points allowed is statistically significant (p-value <0.0123), and suggests that Domination missions affect the player who goes first by significantly reducing the number of points your opponent can score. However go first win rates in Domination games do not support the findings of the OVP differential, so in effect we’re looking at the VP scored in losing efforts. This instead just suggests that Domination primary scoring creates more blowout victories, as once a player is on the ropes the chances of them scoring a 10-point turn drop significantly. This makes more sense as a 10 victory point advantage is not likely to matter given that the average and median margin of victory for games in our sample is around 35.
There may be alternative explanations for this, one could be that Domination data comes from early rounds and may be impacted by the player gap variable. It could also be that OVP simply does not matter, or that when losses in Domination occur, they occur as blowouts more often (Wing’s theory). This is something we can investigate further with more data, and dive deeper into factors like the number of objective markers.
Mission Breakouts
Let’s start with a caveat: There is not enough data to draw strong conclusions from the per-mission results. Additionally, in order to have a complete set of missions, we have included the Vanguard Tactics event data here. That said, there are some interesting directional results to consider here and things to keep an eye on.
| Mission | Games | GFWins | GFW% | Avg VPPG |
|---|---|---|---|---|
| 12 - Scorched Earth | 23 | 16 | 70% | 139 |
| 33 - Priority Target | 12 | 8 | 67% | 150 |
| 21 - Surround & Destroy | 37 | 24 | 65% | 136 |
| 22 - Battle Lines | 50 | 32 | 64% | 128 |
| 31 - Overrun | 62 | 36 | 58% | 140 |
| 13 - Vital Intelligence | 57 | 30 | 53% | 129 |
| 32 - Sweep & Clear | 78 | 38 | 49% | 139 |
| 23 - The Scouring | 50 | 24 | 48% | 129 |
| 11 - Retrieval Mission | 15 | 7 | 47% | 127 |
The big ones to keep an eye on here are Surround & Destroy, Battle Lines, The Scouring, Sweep and Clear, and Overrun, which have seen the most games played and as a result are the most likely to be stable. Of these, Surround & Destroy, Battle Lines, and Overrun all indicate an advantage for the player going first, while The Scouring and Sweep & Clear shows a dead heat for players going first or second. Again, these are heavily entangled with the effects of the round being played, but they’re also the most likely to arrive at a stable result quickly as we add more events data in the future.
Does terrain affect this advantage?
Unfortunately, we do not yet have a systematic way to measure and quantify the impact of different terrain layouts on the Go-First and Go-Second win rates. However, we do think we can draw some insights and possible new hypotheses about how terrain impacts the go-first win rates. We will note that with the terrain layouts below, these are not meant to define every table at these events, but rather to represent the ‘typical’ table seen at the event.
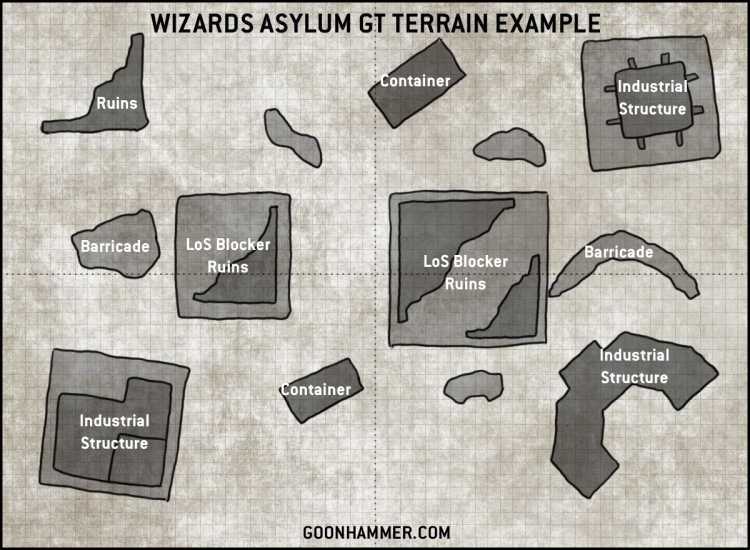
The Wizard Asylum GT
The first of our events on the 9th ed launch day, the Wizard Asylum GT used a mix of terrain types in what is visibly distinguishable as the standard tournament layout, but includes random placement of different obstacle or low ruin walls in addition to major anchor pieces. A mixture of obscuring/light (Ruins), and dense/heavy (Industrial) terrain elements as well as other elements commonly found in the GT packet.
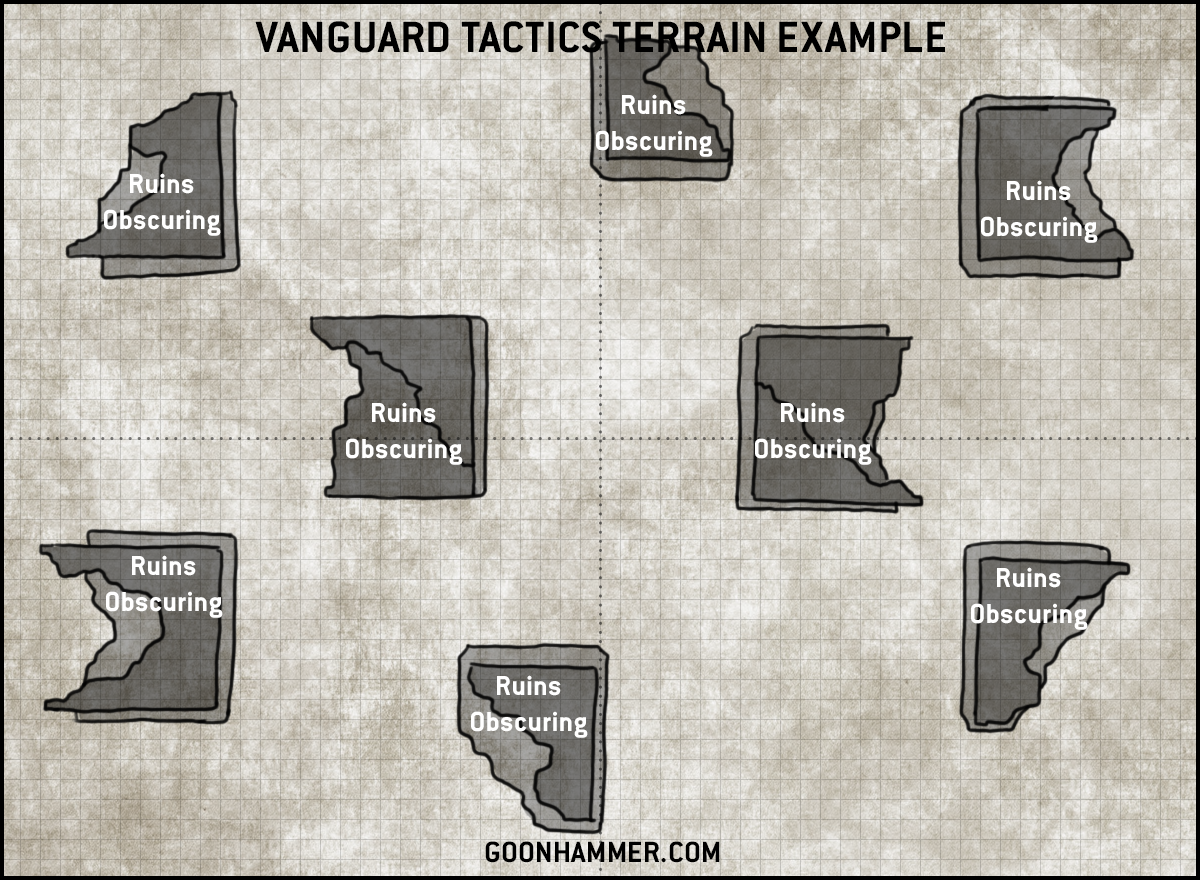
 The Vanguard Tactics Event

The Vanguard tactics event is more distinct in its terrain layout – heavily utilizing large obscuring ruins in a mirrored layout, the VT event ran multiple iterations of this theme. Importantly, the VT event not only ran obscuring on the buildings, but much of the level one of these ruins were blocked similar to the old ITC-style of line-of-sight blocking. This creates a significant amount of line-of-sight blocking that is not seen in the other events in our sample.
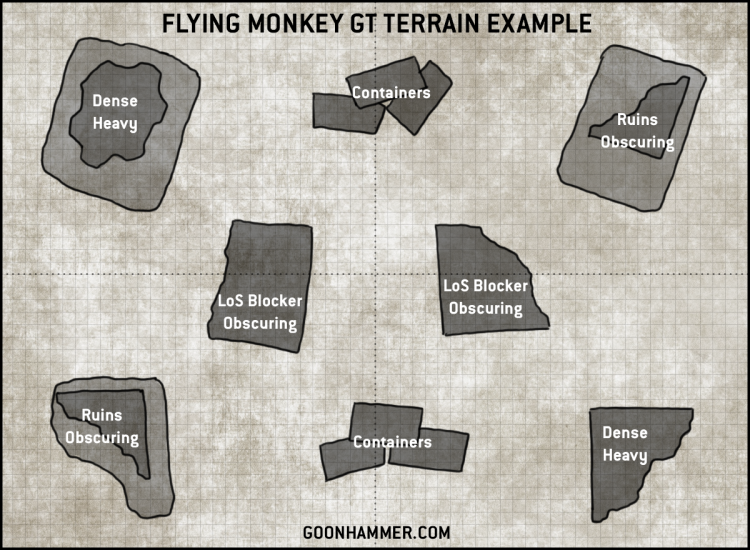
The Flying Monkey GT
Of our events, I think the Flying Monkey GT represents the most ‘typical’ board arrangement for 8th edition style tournaments with a balanced set of mirrored terrain on each players board edge similar to a NOVA-style layout. Like the Wizard Asylum GT, there was a mix of terrain types with some boards having additional obstacle type terrain elements.
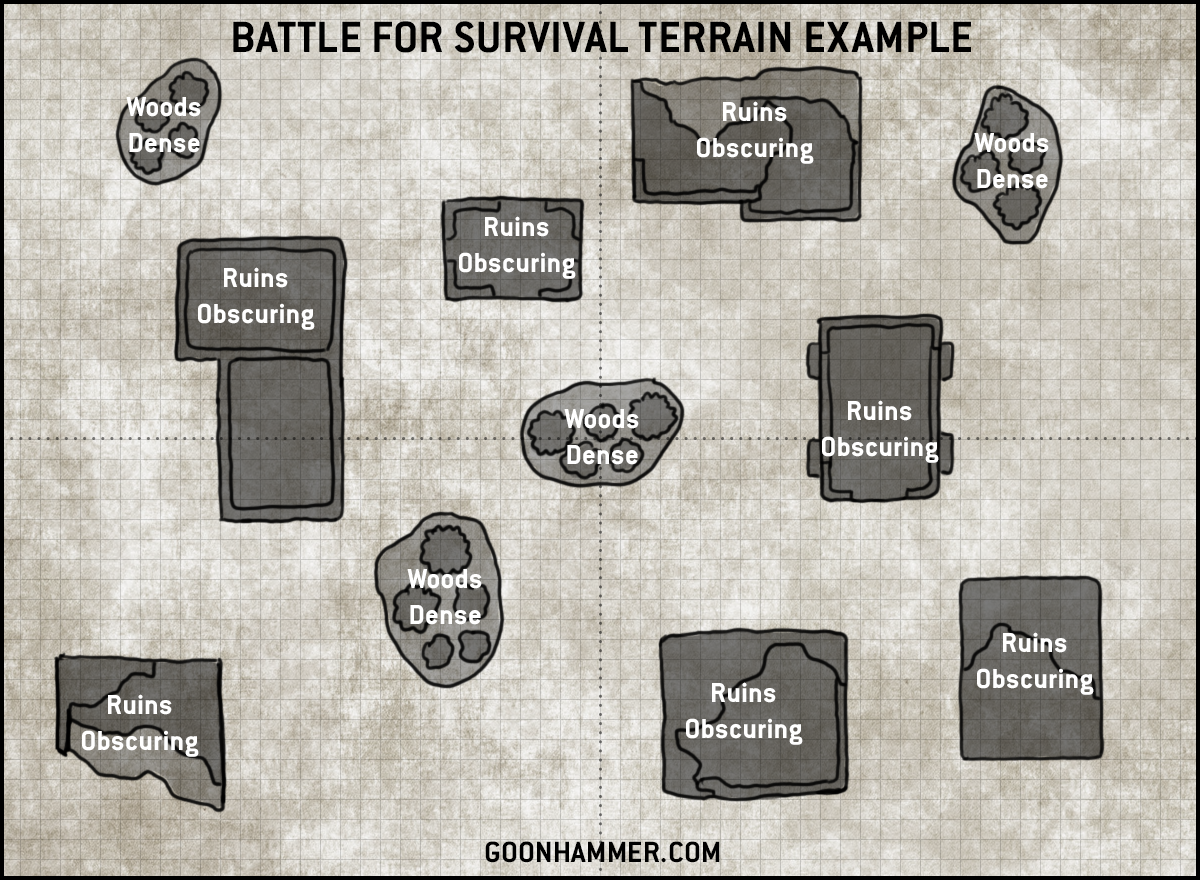
Battle for Survival
The terrain for Battle for Survival is probably the most random (but not unbalanced) of the terrain layout types. It used a similar ruin structure as the Vanguard Tactics event, and similarly all buildings and forests were Obscuring, however, unlike Vanguard Tactics the levels could draw line of sight into the terrain bases – so the end result is a similar level of Obscuring terrain, but lower amounts of line-of-sight blocking, and largely equivalent to the other US events.
The Impact of Vanguard Tactics’ Terrain
Here we would like to pause for a moment and look at the results we have for the Vanguard Tactics event:
- Round 1 – 7/14 Go-First Wins – 50.0%
- Round 2 – Unknown
- Round 3 – Unknown
- Round 4 – 5/15 Go-First Wins – 33.3%
- Round 5 – 6/15 Go-First Wins – 40.0%
- Round 6 – Unknown
The data here stands in stark contrast with what we saw with the other events. Given that both the results and the terrain layout is markedly different from the other events, we believe that terrain – specifically the amount of line-of-sight blocking – may play a significant role. However, it’s worth noting that these results are directional, and are likely heavily correlated with mission as well.
So does terrain affect this advantage? The answer is… we don’t know for sure. In our data, Vanguard Tactics was an outlier in both its (limited) results and also the amount of line-of-sight blocking terrain that conceivably mitigates much of the first turn advantage (but not the scoring or buffing advantages). However, we cannot rule out that we missed significant data in rounds 2, 3, and 6 that may have changed these overall results nor can we rule out that the single event is an outlier. This is very much a case where more data is needed but it does provide us with some some new possible avenues to explore for when first-turn advantage is mitigated and how.
What’s a “Good” score?
While scoring may be dependent on faction and mission, there’s plenty of data here that we can use to identify what a “win” typically looks like and extrapolate from there. Subtracting the paint scores, on average winning players scored 75 points per game, with a standard deviation of 11.6 points. The winning player scored fewer than 75 points in only 15% of the 479 games in the events we looked at (the sample is larger if you don’t need first turn win data). So if you find that your list struggles to reliably score 70 or more points in your test games, it might be time to go back to the drawing board. Likewise, if your secondaries don’t give you a path to reliably score 70+ points, you should reconsider your selections.
You could also think of this as potentially having “four 20-point turns” if you wanted. We’ll almost certainly talk about that in a future article.
What Armies Are Good Now?
“Just show me the stupid army breakdowns!” you say, sick of all of these p-values and two-tailed significance tests. Fine, you animals. Let’s talk factions. If we don’t care about who had the first turn, we can expand our sample a great deal. Using data from Best Cost Pairings and Down Under Pairings, we pulled tournament results for 13 events, including some of the larger RTTs featuring notable players, in the US, UK, Canada, Japan, Australia, and the Netherlands. In total that gave us a sample of 329 lists across 1,523 games played since July 25, 2020. Let’s look at the results.

Space Marines! Space Marines everywhere! You didn’t think they were going anywhere, did you? Everyone still has a Space Marines army and they weren’t exactly hurt by the 9th edition changes. The big growth here is for the Adeptus Custodes, who were the second most common faction in our analysis, seeing a massive boost in popularity likely as a result of hype around the faction’s post-War of the Spider power boost and early analysis of 9th edition suggesting they had emerged from the points change as one of the game’s big winners. But does this hold up?
| Faction | Army Count | Games | Win PCT | Avg VPPG | Wins | Losses | Draws | Total Points |
|---|---|---|---|---|---|---|---|---|
| Harlequins | 7 | 36 | 61% | 70.42 | 22 | 14 | 0 | 2,535 |
| Imperium Soup | 7 | 37 | 59% | 68.73 | 22 | 15 | 0 | 2,543 |
| Drukhari | 7 | 31 | 55% | 63.58 | 17 | 14 | 0 | 1,971 |
| Adeptus Custodes | 35 | 179 | 54% | 67.46 | 96 | 81 | 2 | 12,076 |
| T'au Empire | 18 | 77 | 53% | 62.31 | 41 | 35 | 1 | 4,798 |
| Space Marines | 93 | 421 | 52% | 63.81 | 221 | 191 | 9 | 26,863 |
| Grey Knights | 11 | 56 | 52% | 66.20 | 29 | 27 | 0 | 3,707 |
| Orks | 7 | 29 | 52% | 60.10 | 15 | 14 | 0 | 1,743 |
| Chaos | 22 | 107 | 51% | 63.48 | 55 | 51 | 1 | 6,792 |
| Chaos Knights | 10 | 44 | 50% | 61.70 | 22 | 22 | 0 | 2,715 |
| Grand Total | 329 | 1523 | 49% | 62.73 | 753 | 750 | 20 | 95,538 |
| Aeldari | 10 | 47 | 47% | 64.53 | 22 | 25 | 0 | 3,033 |
| Tyranids | 9 | 43 | 47% | 58.51 | 20 | 22 | 1 | 2,516 |
| Cult Mechanicus | 13 | 59 | 46% | 60.86 | 27 | 31 | 1 | 3,591 |
| Sisters of Battle | 10 | 47 | 45% | 65.68 | 21 | 25 | 1 | 3,087 |
| Necrons | 9 | 38 | 42% | 51.82 | 16 | 22 | 0 | 1,969 |
| Astra Militarum | 17 | 79 | 42% | 64.27 | 33 | 45 | 1 | 5,077 |
| Death Guard | 16 | 75 | 40% | 56.92 | 30 | 45 | 0 | 4,269 |
| Thousand Sons | 8 | 33 | 39% | 52.82 | 13 | 20 | 0 | 1,743 |
| Chaos Space Marines | 10 | 42 | 33% | 52.02 | 14 | 26 | 2 | 2,185 |
| Imperial Knights | 5 | 24 | 29% | 48.83 | 7 | 17 | 0 | 1,172 |
Well, it turns out Harlequins are now the best army. Sorry, Imperium-havers, you may not like it but peak Warhammer performance looks like a clown mask. More realistically, the sample sizes for Harlequins, Drukhari, and Imperium Soup are still very small, and we can confidently say that the sample size for Adeptus Custodes, sitting at a 54% win rate, is not. That’s pretty good early validation for the faction, and it’s worth noting that half of those Imperium Soup lists included Custodes.
HOWEVER. We all know that all Space Marines are not created equal and it’s worth breaking the faction out by supplement (and uh, full codex).
| Chapter | Count | Pct | Win Pct |
|---|---|---|---|
| Salamanders | 12 | 13% | 71% |
| Iron Hands | 4 | 4% | 69% |
| Space Wolves | 14 | 16% | 63% |
| Ultramarines | 11 | 12% | 49% |
| Imperial Fists | 9 | 10% | 43% |
| Raven Guard | 6 | 7% | 48% |
| White Scars | 8 | 9% | 48% |
| Blood Angels | 14 | 16% | 48% |
| Black Templars | 2 | 2% | 44% |
| Imperial Fists | 9 | 10% | 43% |
| Dark Angels | 8 | 9% | 39% |
| Deathwatch | 1 | 1% | 33% |
A few things to note here: While Blood Angels have been more popular than Space Wolves so far, Space Wolves have had a much higher win rate, owing in part to army-wide Obsec and to Jon Kilcullen and Robbie Triplett skewing the results. Thanks, guys.
Also, note the big emergence of Salamanders (and their successors) – Salamanders armies won a whopping 71% of their games, and familiar bogeymen the Iron Hands weren’t far behind at 69%. Space Wolves also helped skew results (63%) despite a larger number of armies, and after them no other chapter won more than 50% of its games.
Overall, these results are mostly promising, provided that Salamanders and Iron Hands armies do not continue to maintain a 60%+ win rate over the next two to three months. Though we’re already thinking about the ramifications of Marines seeing a possible major boost in effectiveness with the October codex…
Discussion
To the best of our knowledge, we are the first to provide this type of analysis with this amount of data. Our analysis leads us to the following insights:
The top-line takeaway is that going-first does provide an advantage. The exact mix of reasons why isn’t yet known, but we do have some data that helps to add color to the question.
First, we have shown that the first day’s rounds had a significantly lower percentage of wins from players who went first than it did on day two. This lends credence to the theory that as a Swiss-paired tournament runs, any advantage to going first becomes more stark as players of equal competency are paired and the second player finds it more difficult to overcome the disadvantage.
Another valuable area to look at is the extent of the benefit of going first. Right now the benefits from a victory points standpoint are difficult to see – the closest we come is looking at differences in points allowed by the player going second in Domination games, and that difference may not be significant. It is interesting to see that a win may look the same points-wise regardless of whether you go first or second and just be easier to achieve.
Possibly the most interesting but hard-to-quantify variable to analyze would be the impact of terrain on the outcome of a game. It’s easy to theorize the significance of decent terrain on a game’s outcome (we’ve all played on planet Bowling Ball), but it’s much harder to define what “good” terrain means, how we would compare various terrain densities, the interaction of terrain keywords, the physical placement on the board, the size and shape of the terrain, how many windows it had, etc. It may be the most significant variable in our analysis and we unfortunately cannot currently quantify it.
We note that this kind of analysis is all retrospective – in developing this ruleset it is hard to truly know how balanced the rules will be once implemented at the table. Play-testing allows for a limited understanding, but as we noted above this type of observation analysis requires multiple iterations in a representative environment – and unfortunately one-off games and RTTs are simply not representative of the competitive GT scene. That said, these results may also shift as players become more familiar with the rules and adept at choosing secondaries and completing objectives within the new rules framework.
Limitations of This Analysis
Before we wrap up we need to highlight the limitations of our analysis. Variables that remain not quantified in terms of the impact to our analysis include: individual factions, event army mix, secondary scoring choices, terrain placement, player skill gaps, and a number of other hidden variables. It’s likely that all of these factors have some level of effect on the outcome of a game – and without being able to quantify and measure their effects, and without more data, we cannot do the regression analysis that would tell us which of these matters, which don’t, and which are the most significant to going first and winning.
Let’s also not forget that we saw win faction-dependent win rates above and below 50% well before these missions were released. Army faction has a strong effect on the outcome of a game, which anyone who recalls playing against 8th edition Iron Hands will recall. While we have statistically shown that going first does appear to provide meaningful effects on the game outcome (with the limited data we have), individual factions may not be equally affected by the go-first advantage. At the very least, the faction effect is something that is extremely relevant and not something specifically accounted for in this analysis, due to limited data points.
As should be clear by this point, the biggest limitation to the analysis is the data size being extremely small. Compared to the tens of thousands of games recorded and analyzed during 8th edition this data set is woefully small. As our sample size increases, so too will our confidence in our conclusions as well as the breadth and capability of our analysis.
Conclusions
We’re excited to see some initial results coming out of large events using the 9th edition rules and mission pack. There is evidence that the player going first wins more games, and because there’s no way to affect who goes first strategically (unit drops no longer have an effect), that’s a tough pill to swallow.
- Statistically significant: The player who goes first wins more games.
- Statistically significant: Later rounds – and Day two games in particular – are more likely to feature the player who goes first winning.
- The Missions played and their Primary Objective scoring likely have a significant impact on game results based on which player goes first, but more data is required to validate this.
- There are many variables that likely contribute to the game’s go-first outcome that we cannot directly account for with the data we have. Terrain may be a big one here.
- With only 340 games to analyze at the moment it’s hard to statistically draw more conclusions.
In short, we need more data! Both to confirm our findings and to determine why going first results in more wins. The more data we have the more we can do with it. The terrible ongoing COVID pandemic is doing its best to keep that from happening but there are increasingly more locations around the world that can and are hosting safe tournament events. As the number of safe events increases, we hope we can further our analysis in partnership with you. If you’re running an event we would love to include data from it into our data set for future analysis. At a bare minimum, we need information on who went first and which table (BCP), and what mission was played in each round. Nice-to-haves would be a series of pictures of the typical table layouts.
This is asking a lot of TOs who are already dealing with more than they signed up for, accommodating for COVID health precautions. We realize that. Data collection must come secondary to running the actual event, and running it safely. However, there are real benefits to the data collection and we think the effort is worth it. Having more data facilitates the conversation of overall balance in the game, which directly contributes to the longevity of competitive 40k as well as to the individual player enjoyment of even casual games. At the end of the day, we all care about the game of 40k deeply and want to see it in a healthy state for as long as possible. Data collection and analysis helps quantify game balance in ways that previous editions could never achieve.
Acknowledgments
We want to take a moment to highlight our partners within the 40k community who have made this possible. We sincerely appreciate and thank you all for agreeing to take part in this effort! For other upcoming tournament organizers – we duly invite you to message us and to partner with us to better understand 9th edition and the dynamics within the competitive community!

Brian ‘Bam’ Hunter
Brian is the TO behind the Wizard Asylum GT that occurred July 25-26th in Wichita, Kansas, and with 32 players was the first recorded 9th edition GT. More recently, he TO’d the Flying Monkey Con in which 74 players hit the tables for a 6-round Major. He co-hosts the Flying Monkey podcast and also owns and operates the Wizard on the Asylum Comics & Games store in Wichita. He is also recently engaged and I heard he likes cigars and scotch if you’d like to celebrate with him!

Duncan Ensminger
Duncan is the team captain for the Flying Monkeys and co-organizer of the Flying Monkey Con as well as co-host for the Flying Monkey podcast. He is responsible for the lion’s share of the data that has been collected to date and has made much of this possible with his detailed and determined collection of data throughout the con.

Patrick Fearis
Patrick is the TO of the recent 5-round Battle for Survival event in the UK. He runs a YouTube channel called BFS Wargaming where you can find an extensive collection of battle reports and rules discussions. The Battle for Survival was sponsored by MAD Gaming Terrain.
 Stephen Box
Stephen Box is the TO of the Vanguard Tactics events in the UK and also the owner/operator of the Vanguard Tactics Academy and video podcast – he has been featured previously on Goonhammer for his Blood Angels lists and he helped author Faction Focus: Blood Angels.
What’s Next: The Round Table
That wraps up our first look at the 9th edition meta. We’ll be back early next week with some thoughts on these results from some of our competitive players and where we expect things to go from here. As always, if you have any questions or feedback, drop us a note in the comments below or email us at contact@goonhammer.com.
Appendix
Our dataset consists of a series of game outcomes defined by either a win, loss or tie. If we exclude the small number of tie results what we’re left with is a discrete random variable with binary values: {win, lose}. This means that we can expect that the distribution of go-first wins for a series of events will follow a binomial distribution. In an ideal situation, over a large enough sample of games the probability of a player winning would be the same regardless of whether they go first or second, which would yield a distribution symmetric around the mean, and be the same as a coin toss. Therefore, similar to the same way we might test if a coin is “fair” after n tosses, we can use a similar test to determine if our go-first win percentages are likely to be the result of chance or an indicator of a significant skew. This is a classic problem in statistics.
For our ideal “coin flip” situation, the variance for 340 tests is going to be np(1-p) or 340(1/2)(1/2) = 85 and the standard deviation is going to be the square root of that, or 9.2. In our sample of 340 games we had 197 go-first wins, which is just under 3 standard deviations above the expected mean of 170, and statistically significant with a 99% level of confidence.
Kevin: Since our goal is to examine the probability of winning we can use a binomial test. We compare the probability of winning when going first (57.9%) to the expected probability (50%) over the 340 samples and get a z-score of 2.93. The resulting p-value (0.00339) is less than our significance level of 0.05, which means we can say that there’s a statistically significant difference in the win probability of going first or second for the sample set. If we look at the individual events then only The Wizard Asylum GT had a statistically significant difference in win percentage. This is likely due to the small sample size, and emphasizes how important it is to get more data. These scores and levels are for a two-tailed test which is the most conservative. If we instead look for a one-tailed test (which is less conservative but may be more appropriate since we’re looking at only whether one result is higher than the expected value) then the both The Wizard Asylum GT and the Flying Monkey GT reach the threshold necessary to declare a significant difference.
Boon: We used a two-sample t-test to examine VP differentials between first and second. In all of these tests we use a significance level of 5% with the following hypotheses:
Overall VP t-stat of .0557 and a p-value of <.5221 – accept the null
-
- The null hypothesis, H0: μ1 – μ2 = 0
- The alternate hypothesis: H0: μ1 – μ2 > 0
Overall OVP with a t-statistic of -2.7386, p-value of <.0038 – reject the null
-
- The null hypothesis, H0: μ1 – μ2 = 0
- The alternate hypothesis: H0: μ1 – μ2 < 0
We again used the two-sample t-test to examine VP differentials between first and second in Domination and Take & Hold missions. In all of these tests we use a significance level of 5% with the following hypotheses:
Domination VP t-stat of 1.0615 and a p-value of < 0.8483 – accept the null
-
- The null hypothesis, H0: μ1 – μ2 = 0
- The alternate hypothesis: H0: μ1 – μ2 > 0
Domination OVP with a t-statistic of -2.7607, p-value of <.0123 – reject the null
-
- The null hypothesis, H0: μ1 – μ2 = 0
- The alternate hypothesis: H0: μ1 – μ2 < 0
Take & Hold VP t-stat of -.8549 and a p-value of <.1973 – accept the null
-
- The null hypothesis, H0: μ1 – μ2 = 0
- The alternate hypothesis: H0: μ1 – μ2 > 0
Take & Hold OVP with a t-statistic of -1.5954, p-value of <.0593 – accept the null
-
- The null hypothesis, H0: μ1 – μ2 = 0
- The alternate hypothesis: H0: μ1 – μ2 < 0
The results tell us that players who go-first are not likely to score any more points than if they had gone second; however, players who go first are likely to prevent their opponents from scoring more points than if they had gone second. We’ve addressed several potential causes for this in the article.