This week’s Hammer of Math (the 50th article, believe it or not) is a bit more fundamental than previous articles; we’re going to take a look at the effects of variance and expand beyond the concept of expected damage into the actual distribution of outcomes.
Most games rely on some kind of probability chain to produce a desired effect. In Warhammer 40k the chain is the sequence of attack roll, hit roll, wound roll, save roll, damage roll, and ignore wound roll. In the very first article we divided this into a series of driving rolls (attacks, damage) and gatekeeping rolls (hit, wound, save, ignore wound). The difference between driving and gatekeeping rolls is the effect they have on the ultimate outcome. Driving rolls determine the magnitude of the effect; for example going from a Damage characteristic of 1 to 2 will double the number of wounds dealt to the target. Gatekeeping rolls determine the probability of the attack being success; if you don’t hit the amount of damage dealt is irrelevant. The formula from the first article is found below:
Expected Damage = Shots x Damage x P(Hit) x P(Wound) x [1 – P(Save)] x [1 – P(IW)]
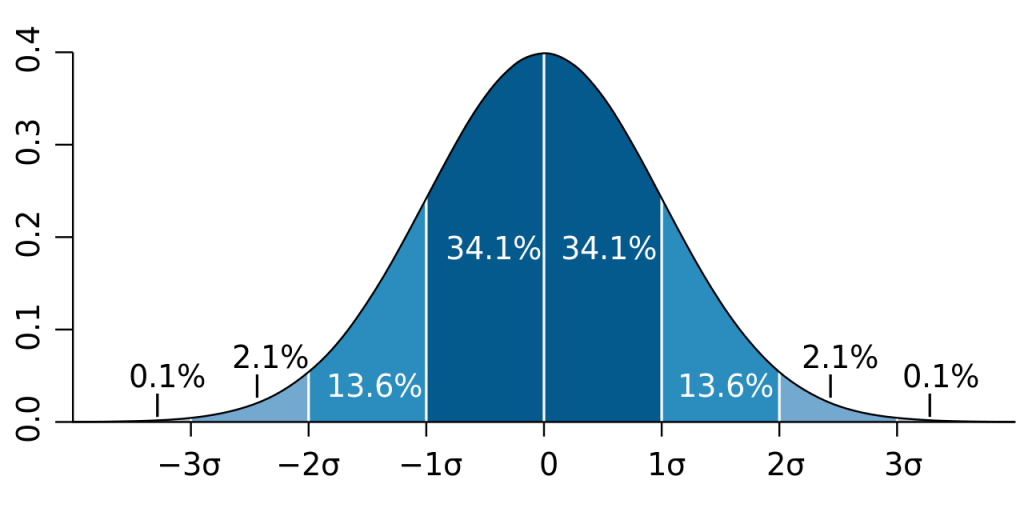
This series often uses the concept of expected damage to describe the effect of an attack, and as a quick reference it’s very helpful. Expected damage is the average outcome that will occur over a sufficiently large number of attempts. For example a Space Marine firing a bolter at an Ork has an expected damage of 0.28; 28% of the time it’s going to deal a single wound and kill the Ork. Double the number of shots and the probability doubles to 56%. Re-roll a value of 1 to the hit or wound roll and the probability increases to 32% (117% of the original probability, or 7/6). The curve for this event is a simple step, which makes sense for a single attack. But what happens when you make more than one attack? Then we begin to see a probability distribution. With a large enough sample size the probability distribution will form the shape of a bell curve, a normalized distribution centered around the expected damage value. The width of that bell curve is the standard deviation, and under normal circumstances the result of a sample will have a set probability of falling within a given distance from that curve. The more a result can vary from the expected value, the greater the deviation and the more likely it is that you will see results that deviate significantly from the norm. An attack with a mean of 9 damage dealt and a standard deviation of 3 is more likely to inflict 12 damage than an attack with the same mean but a standard deviation of 1. The attack with the greater standard deviation is also more likely to inflict 6 damage; you pay for the good with the bad.
Variance in Driving Rolls
Within Warhammer 40k two of the most common sources of variation are a variable number of shots and a variable damage value. Assuming a fixed probability of damage, does the source of variation affect the outcome? In other words does it matter if my unit of 6 models is firing 1d3 shot weapons that deal 2 damage each, or 2 shot weapons that deal 1d3 damage each? The expected value for each attack should be the same; 6 models firing an average of 2 shots and dealing an average of 2 damage multiplied by the probability of damage. Assuming a 4+ to hit, 4+ to wound, and a 4+ save that’s around 3 wounds per attack. Does the variation change if the probability of damage is different; would the result be different if the attacking unit had a 2+ to hit, 2+ to wound, and the target got no save at all? To work that out I ran 10,000 samples of the scenario under the conditions listed and obtained the mean and standard deviation of the result.
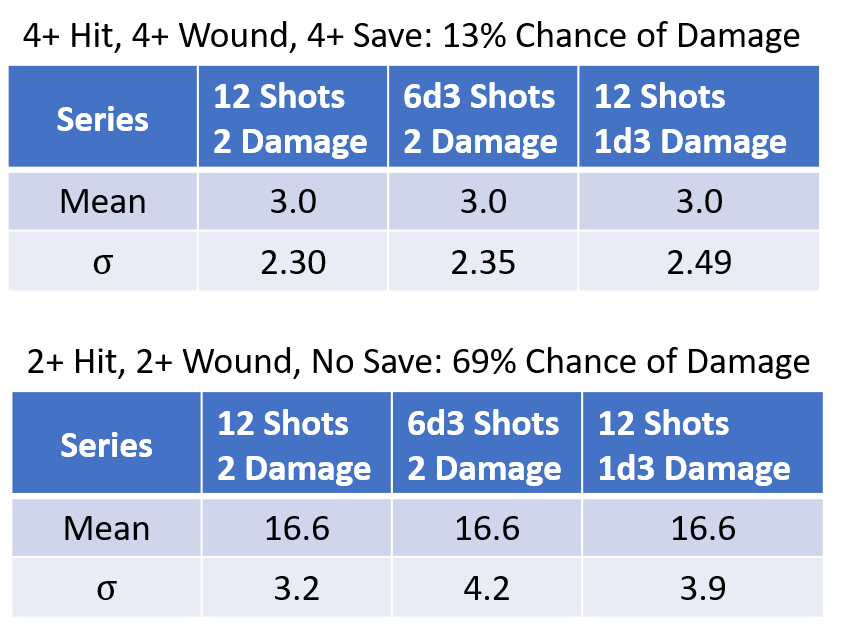
As expected the mean value for all of the results was the same; 3 wounds for the 4+ scenario and 16.6 for the best case probability. Where things get interesting is in the changes in standard deviation. Across multiple iterations of the same scenario the standard deviation never varied more than 0.02, so these differences appear to be significant. For the scenario where the probability of damage was only 13% the scenario where damage was random produced a higher variation than the scenario where the number of shots was random, and but the standard deviation only increased by a maximum of 108% of the baseline value. For the scenario where the probability of damage was 69%, randomizing the number of shots produced a higher standard deviation than randomizing damage. For the higher probability scenario the increase in variance was also higher, with a maximum that was 132% of the baseline.
The reasons for these outcomes can be seen in the probability distribution curves below. These curves are slightly different than the bell curve; instead of showing the distribution of results they show the distribution of results that are greater than or equal to a given value. This is more helpful for miniature wargaming, as it’s more important to know the probability that an attack will deal at least 3 damage rather than a specific amount. The 50% mark indicates the peak of the bell curve. The blue lines represent the high probability scenario, the orange lines the low probability scenario. The solid lines show the baseline, with fixed damage and attacks, while the dashed lines show the result with the random variable; either damage or number of attacks. We can see that for the orange lines 20% of the attacks result in no wounds dealt, while for the blue lines all of the scenarios inflicted at least some damage.

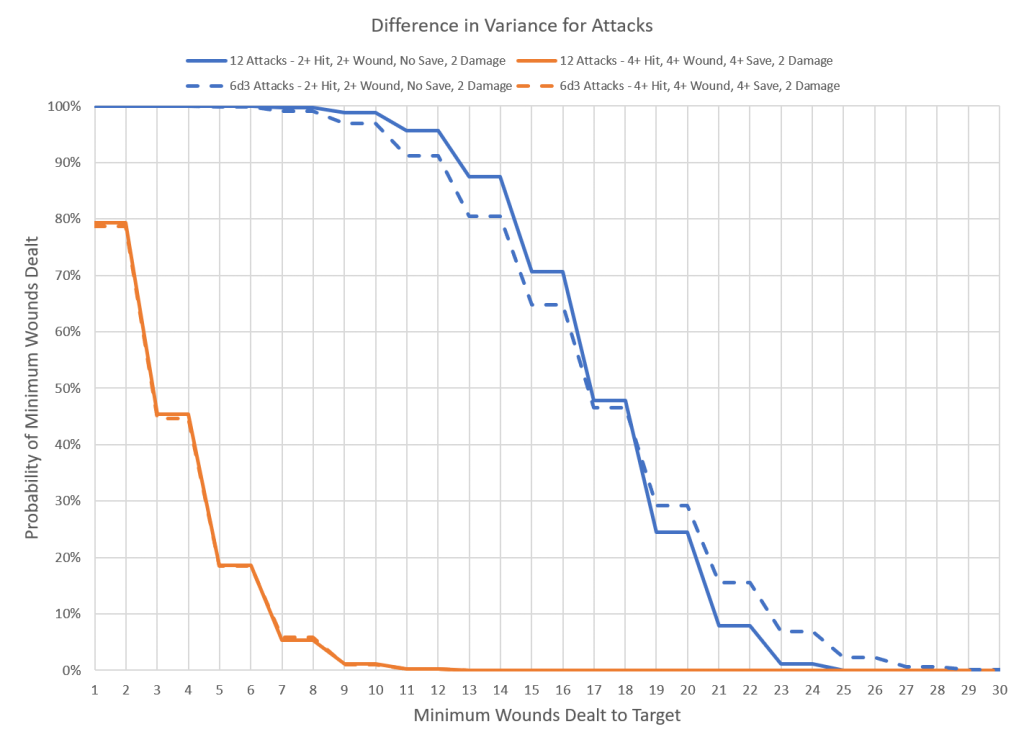
These results show an important distinction; as the proportion of zero results in a distribution decreases the sensitivity of the outcome to randomness in the attack or damage roll increases. In the case of the low probability scenario the curves largely overlapped, particularly when the damage was fixed. The increased variation between the fixed and variable damage for the low probability scenario can be attributed to the different shapes of the stepped curve for the fixed damage compared to the smooth curve for the variable damage. For the high probability scenario the three curves are more disparate. In this case the smoothed curve from the variable damage is closer to the baseline than the stepped curve from the variable number of attacks. This means that for models that have a high probability of inflicting damage with an attack having variable damage will be less random than a variable number of attacks.

Wrapping Up
While it’s easy to look at expected value and get a basic understanding of what an attack should do, beneath the surface is a complex combination of effects that drive the probability of an outcome. As a player it is up to you to decide how to balance that risk and reward; would you prefer to focus on low variance but reliable attacks, or is it more appealing to bring high variance attacks which have the potential to deal a devastating amount of damage in a single phase? While reducing an attack down to an expected damage value reveals the most likely result, understanding how much a given combination of factors affects the variation of that result is critical for determining that risk level.
- Within Warhammer 40k the probability that a given attack will successfully inflict damage plays a major role in determining the sensitivity of the outcome to randomness in attacks or damage.
- Attacks with a low probability of success are less sensitive to randomness due to the significant presence of zero damage results; it doesn’t matter how wacky an Ork’s gun is if he misses most of the time.
- Attacks with a high probability of success are more sensitive to randomness within the number of attacks or Damage characteristic thanks to the mean being larger and there being fewer null results.
- High probability attacks are particularly susceptible to weapons that deal a random number of attacks and a fixed damage thanks to the stepped probability distribution curve.
For those interested in doing their own research, I highly recommend the Warhammer Stats Engine. It provides an explicit result which works well for most scenarios.
Thanks for reading! If you have any feedback, feel free to drop a note in the comments below or email us at contact@goonhammer.com. If you have any questions that you would like answered in a future article, please submit them here.