Hello again, Dear Reader! Primaris Kevin is once again out this week, taking some much-needed paternity leave to celebrate a new arrival. And that means you get me again, focusing on competitive play statistics. If you’re a regular reader on the site, you’ll likely be aware that we recently acquired, updated, and relaunched the 40kstats website, an online archive of tournament results and statistics. But while some of those statistics are pretty self-explanatory, others are more difficult to decipher. And which stats matter when you’re trying to evaluate a faction and its viability?
In today’s article I’m going to run through the major stats we use on the 40kstats site, talk about how they’re calculated, and what they mean when evaluating a faction. I’ll also talk about a few that aren’t being displayed on the site yet, but will be in the near future.
First, let’s start with the easy ones:
The Basic Stats
We pull most of these stats from the ITC Battles App, the premier app for tracking and managing your games. Data from games – both practice and tournaments – are collected in the app, filtered to remove bad results and old mission packs, and then aggregated for statistics purposes.
- Win % – This is the percentage of games won by all players reporting that as their faction. It’s the number of wins divided by the total number of games. Note that it’s possible for games to end in a draw, something that happens in about 1.2% of games.
- True Win % – When we’re comparing factions, it’s kind of silly to include “mirror match” games where one player plays another with the same faction – the faction’s win rate in these games will always be 50%. True Win % is the win rate for the faction with mirrors removed.
- VP – The average amount of VP scored by all players reporting games for a specific faction. It’s the sum of all VP scored divided by the number of games. Note that a player’s chance of winning increases as they score points, but tends to increase rapidly around 70 VP scored, and 90% of players scoring 85+ points win their games.
- Opp VP – The average amount of VP scored by all players playing games against the reported faction. It’s the sum of all VP scored against divided by the number of games. The higher this score, the less likely a faction’s chance of winning. Generally, factions with a higher average VP than Opp VP will have a win percentage over 50%, though not always – we’ll talk more about this in Expected Win Percentage, below.
Awesome, let’s get into the Good Stats.
The Advanced Stats
These are the stats that we already pull and calculate. Most of these come from GT games played and reported in Best Coast Pairings, the premier tournament management app.
- Average First Loss – The average round in which players with the reported faction received their first loss. The higher this number, the more likely a player is to go deep into an event, playing harder opponents and racking up wins. This is a great stat for identifying broken factions – a really high Avg. First Loss indicates that even weaker players are doing well with the faction, suggesting it has a very high floor. A faction with a lot of event wins but a low Avg. First Loss is a faction that is likely powerful, but skill-intensive and difficult to play. A faction with a high average first loss and a low TiWP ratio is a gatekeeper.
- TiWP – Tournaments in Winning Position, which Val Heffelfinger would like you to know was his idea initially, tracks events where a player with the reported faction was in a position to win the event. For the purposes of this stat, we consider any instance of a player starting 4-0 as a Tournament in Winning Position, representing that most GT events run 5-6 rounds. Because events tend to pair players on wins or win path, the winner of an event will typically be the lone player who finished undefeated. We pronounce this as “T-whip” when we talk about it.
- TiWP Share – The percentage of TiWP lists for a reported faction out of all the TiWP lists. At any given GT event you’ll have more than one TiWP list, and so this is the number of TiWP lists for a faction divided by the total number of TiWP lists recorded for a specific date range.
- Field % – For some of these stats, we want to know what percentage of players were running a faction. This is the number of reported lists for a faction divided by the total number of players/lists. Generally, the larger this number, the harder it is for a faction to do well – more players playing your faction likely means more weaker players, which will tend to drag down the average and level things off. If this number is really high and a faction still has a high win rate, it’s probably broken.
- TiWP Ratio – This is the good shit. This is probably the single most important stat of the ones we look at to determine faction strength. Lots of factions can produce an occasional winner, but if everyone’s running a faction, you’d expect it to rack up more raw win counts. Enter the ratio – we divide TiWP share by Field % to produce TiWP ratio. Generally speaking, in a balanced meta if a faction represents 10% of players, we expect them to also produce 10% of TiWPs. If this number is over 1, a faction is outperforming its expectation, and if this number is less than 1, it’s underperforming. Anything over a 1.5 is exceptional, and anything over a 2 is likely broken, though this also depends on the raw Field% of the faction.
A good example of how we use this data is to look at Tyranids right now – Since April 25th, Tyranids have made up 10.4% of the field at GT events, and during that time have a TiWP share of 35.7% – that’s insanely high. As a result, their TiWP ratio is a staggering 3.43. Their average first loss occurs in round 3.2.
However while Tyranids have been everywhere, it’s hard to track their dominance against other factions. To put this into perspective, here are some comparable TiWP ratios from this year:
- Harlequins pre-dataslate (3/7 – 4/25): 4.12 / 5.1% of the field / 2.7 first loss
- Custodes pre-Aeldari (1/21-3/7): 5.50 / 5.2% of the field / 2.1 first loss
- T’au pre-Aeldari (2/7-3/7): 2.03 / 10.7% of the field / 2.3 first loss
- Asuryani (4/25-6/5): 1.76 / 5.2% of the field / 2.6 first loss
- Drukhari (4/25-6/5): 1.51 / 2.0% of the field / 2.7 first loss
- Harlequins post-dataslate (4/25-6/5): 1.81 / 5.1% of the field / 2.7 first loss
- Custodes post-dataslate (4/25-6/5): 0.69 (nice) / 5.2% of the field / 2.1 first loss
- T’au post-dataslate (4/25-6/5): 0.71 / 10.7% of the field / 2.3 first loss
While Tyranids don’t quite have the astronomical TiWP ratios of the Custodes and Harlequins, they have two other stats that are very worrying – first, their 10.4% field ratio is massive for a faction with a ratio this high, and second, their average first round loss is almost a full round later than most of these other dominant factions. So while Tyranids aren’t putting up the raw win percentage totals that Harlequins did, they’re also clearly a stiflingly good faction that even novice players can pick up and perform well with. This is likely in part because the faction’s strength is built on a large number of undercosted units with overpowered datasheets – there’s plenty of raw power that doesn’t require trickery to use.
Upcoming Stats
Here are some stats we’ve been talking about, and may have showcased in the past, but haven’t yet put on the site on a regular basis. They need a bit more vetting, but we’re looking to start having them up soon.
- Go First Win Rate (GFWR) – This is something we’ve talked about a lot in the past, and will revisit soon. Go First Win Rate is the percentage of games won by a player with a reported faction when they won the first turn roll-off. It’s the number of games where a player went first and won divided by the total number of games where they went first. Go First Win Rates can help us determine if a faction needs a strong alpha strike to be successful, or if there’s a massive advantage to one player going first in the mission structure.
While we’re here, let’s do a quick update on Go First Win Rates: After two years, GW finally got there with Nachmund. Our data in the ITC Battles App Through May shows that the Go First Win Rates for Nachmund Missions is 52.5% for Tournament games and 54% for practice games, averaging out to 53%. 52.5-47.5 is extremely acceptable and as close to perfect as I think you can get in an IGOUGO game like 40k. Did some of it require adding a bunch of factions that can annihilate half the field going first or second? Possibly. But the changes in Nachmund scoring and ongoing tweaks to secondary objectives and an emphasis on more terrain didn’t hurt, either.
Currently, the faction that relies the most heavily on going first to win is the Astra Militarum, which wins 61% of its games going first and 35% of its games going second. That’s… incredibly dire, but anyone who plays the faction already knows this. What’s more surprising are Harlequins, Custodes, T’au, and Tyranids four armies that all performed better going second, and are major drivers for the decrease in overall go-first win rates.
- VP Differential – The difference between the average VP scored by a faction and the average VP allowed/scored by opponents. Positive numbers are good and correlate to winning (r=0.9), negative values to losing – for the most part, anyways.
- Pythagorean/Expected Win percentage – This is something I’ve been noodling over, ever since I noticed that some factions have a negative VP differential but a win rate over 50%. Drukhari, for example have a Real Win % of 51.72% since January 1st but a VP differential of -0.25.
Pythagorean Wins are a concept that originated with Bill James while he was looking to model the number of games a baseball team “should” have won based on the number of runs scored and allowed. Basically if you think of a game of 40k as a game of scoring VP and denying points, then an army/faction that’s good at creating large differentials should, over time, create better results. In practical terms, this means that armies that blow out weak opponents and lose close games should be better than armies that win big and lose big.
While the original formula for pythagorean wins is (points scored^2) / (points scored^2 + points allowed^2), that’s been tweaked by various sports based on minimizing prediction error. Similarly, after doing some error calculations, I ended up on a tweaked coefficient that yielded the following table:
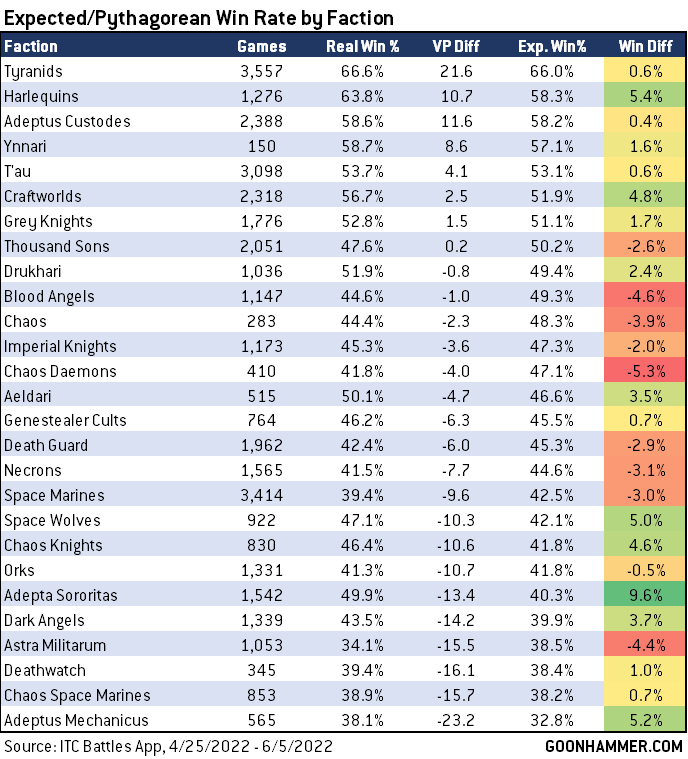 The other general idea is that factions that outperform their expected win percentage are likely to drop in the future, while factions overperforming are likely to improve. In a lot of ways this can be a leading indicator of performance if we can get the data fast enough. It might also tell us where a faction is being propped up by a small number of superior players. Finally it can also tell us when factions win small and lose big, and give us some food for thought on future analyses. In this case it suggests that Space Wolves, who have among the lower average VP scored (67.5), are squeaking out wins and getting blown out in their losses. In similar fashion, Dark Angels players tend to score more points (73 average) owing to some strong secondaries, but also give up more than any other faction (78.3).
- Faction Player Strength – Finally something we’ll be looking at in the future is evaluating the general strength of a faction’s players, and tracking how players move from one faction to another, what we might otherwise call “the Siegler Effect.” When you start talking about factions that represent a small percentage of the field – such as Harlequins – it’s easy for a small number of very good players to make a big difference in a faction’s results, and so we’ll look to chart a few things here:
- The average player strength of players playing a faction
- The flow of players (and player strength) switching to a given faction over time
- The expected performance of that faction based on the average strength of its players
And this in turn leads us to a personal stat:
- Value Over Replacement Player (VORP) – This is another baseball analytics stat, this time measuring the average value of a player against some random scrub who just picked up an army for their first RTT. the general idea here will be to track how well a player outperforms the average player with the same faction, and chart this against every faction the player plays at each point in time.
There’s a lot of stats work for us still to do around these, but I’m excited to keep working on it and find ways to better describe 40k and the dynamics occurring in a game.
That wraps up our look at stats. Hopefully you’ve got a good idea now of what the key stats are and how we’re calculating them, and how they can explain what’s going on with a faction and when something is broken. We’ll be doing more work on this in the future, so keep dropping into the new 40kstats site – which updates Mondays – and logging your games in the ITC Battles App.
Have any questions or feedback? Drop us a note in the comments below or email us at contact@goonhammer.com.